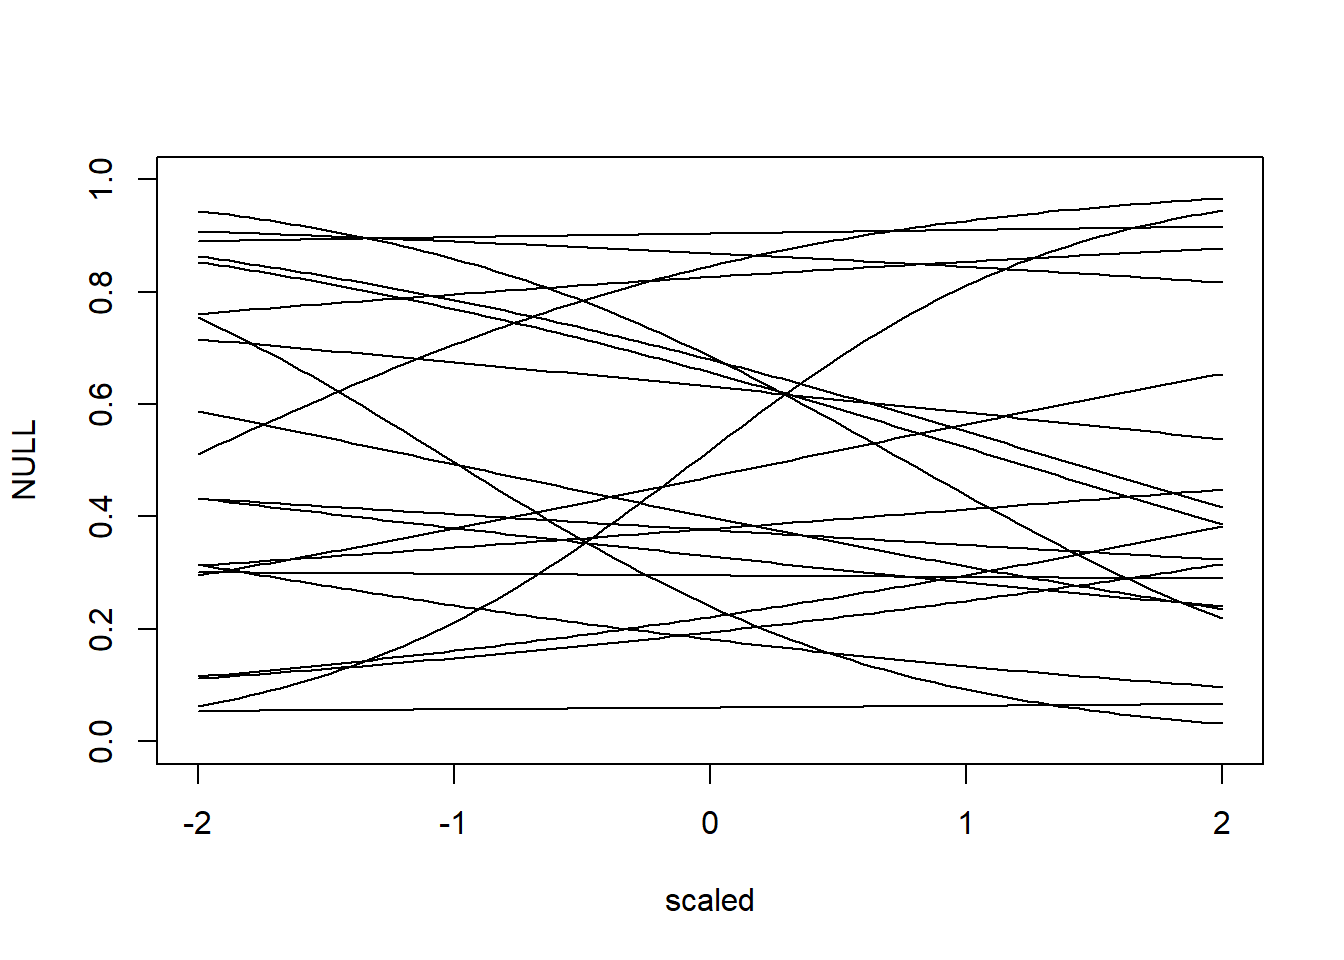
N <- 20 # number of simulations

alpha <- qlogis(rbeta(N, 2, 2))
beta <- rnorm(N, 0, 0.5)

plot(NULL, xlim = c(-2, 2), ylim = c(0, 1), xlab = "scaled")
for (i in 1:N) {
  curve(plogis(alpha[i] + beta[i] * x), from = -2, to = 2, add = TRUE)
}
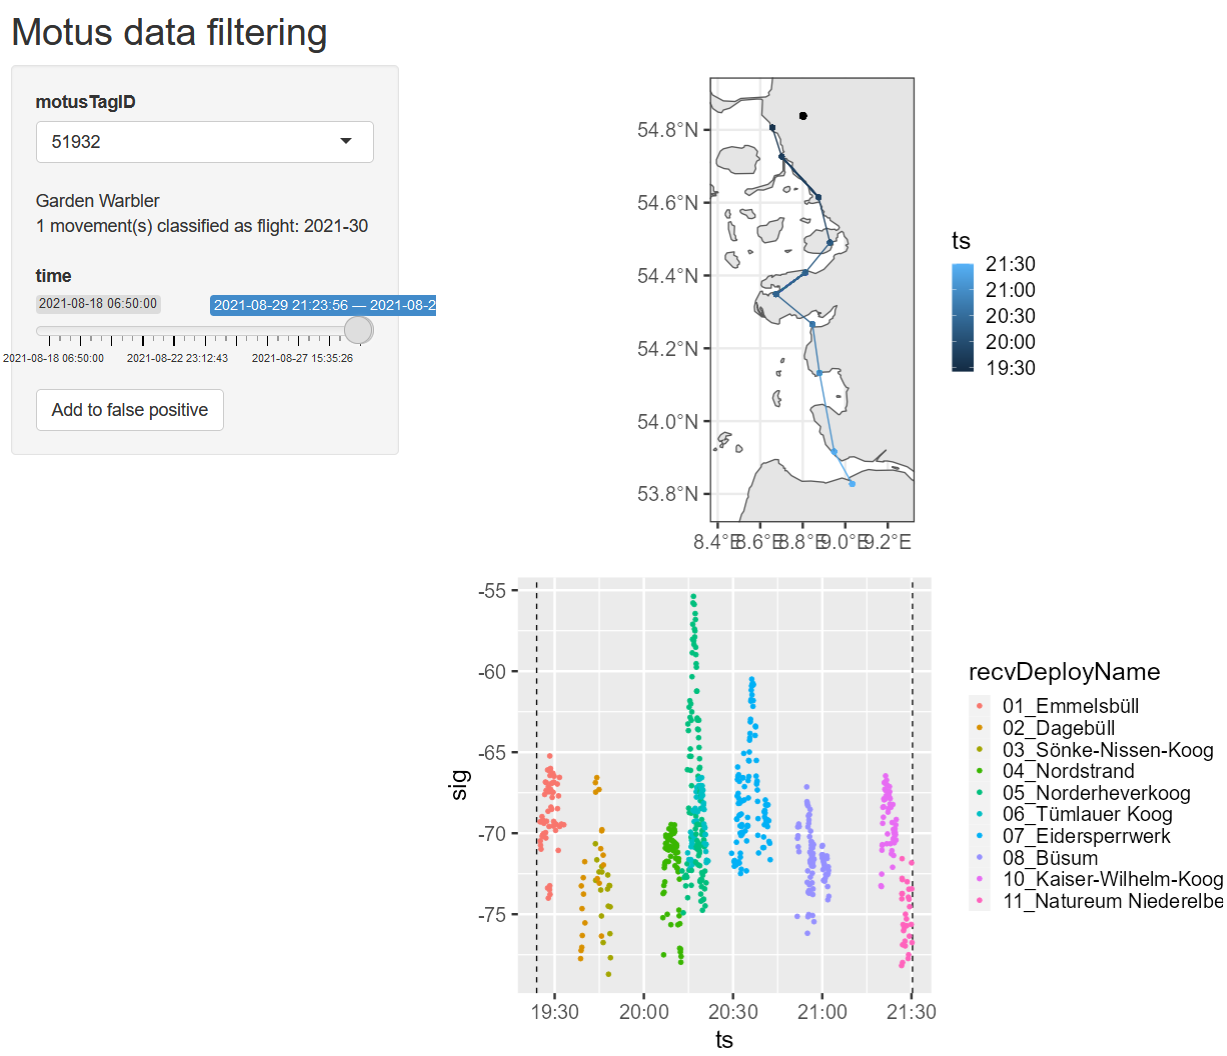
runLen > 3Starting east of 8°E and north of 54°N with a distance of > 50 km between first and last receiver.
flightID flight identifierflightStart start time (max signal strength at first receiver within last half hour)flightEnd end time (last detection)flightDate sunset date of departureminStopover minimum stopover duration in daysFind departures without detected flights: movements of > 50 km within one day.
minLength minimum movement lengthRun Shiny app data/app.R to:

In [1]:
N <- 20 # number of simulations
alpha <- qlogis(rbeta(N, 2, 2))
beta <- rnorm(N, 0, 0.5)
plot(NULL, xlim = c(-2, 2), ylim = c(0, 1), xlab = "scaled")
for (i in 1:N) {
curve(plogis(alpha[i] + beta[i] * x), from = -2, to = 2, add = TRUE)
}In [2]:
plot(NULL, xlim = c(0, 600), ylim = c(0, 0.05), xlab = "lengthW")
abline(v = c(50, 300), lty = 2)
for (i in 1:N) {
  lines(density(rlnorm(1e4, log(50), 0.2)))
  lines(density(rlnorm(1e4, log(300), 0.2)))
}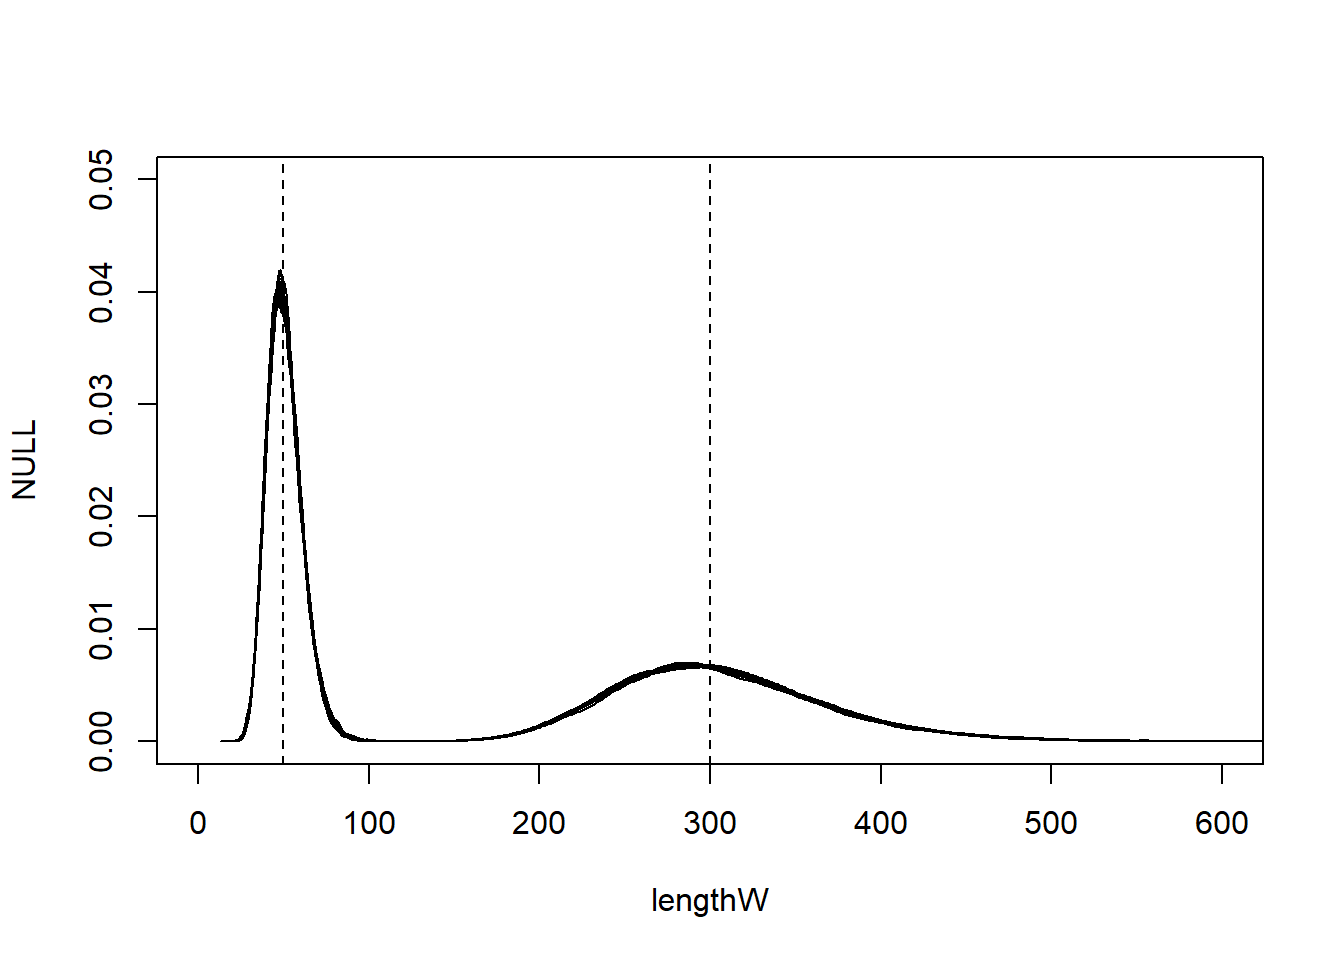
The code to simulate and analyse data from the generative model can be found in 4_mixture_simulation.R.


